

As Hurricane Matthew approaches Florida, Georgia, and the Carolinas, NLDAS datasets are used to view soil moisture conditions. Some locations are expected to receive heavy rain, depending on the exact track of the storm. Many locations already have very wet soils, particularly in eastern North Carolina. These soils are wet from higher than usual rainfall during the month of September. Additional rainfall associated with Matthew in these wet soil locations have the potential to increase localized flooding in inland areas.
Disclaimer: This post is not intended to be a forecast and is only a look at the current soil moisture conditions. For the latest forecast and warnings for your area, please see the National Weather Service and/or the National Hurricane Center.
Figure 1 depicts the NLDAS-2 Mosaic LSM soil moisture percentile in the top 1-meter of soil in eastern North and South Carolina on Oct 1, 2016. The values show the percentage of years within the climatology with drier soils on Oct 1st of each year. For example, areas with a value higher than 90 indicate that the current soil moisture values are wetter than 90% of the years for this time of the year. Eastern North Carolina and northeastern South Carolina have localized areas over the 98th percentile.
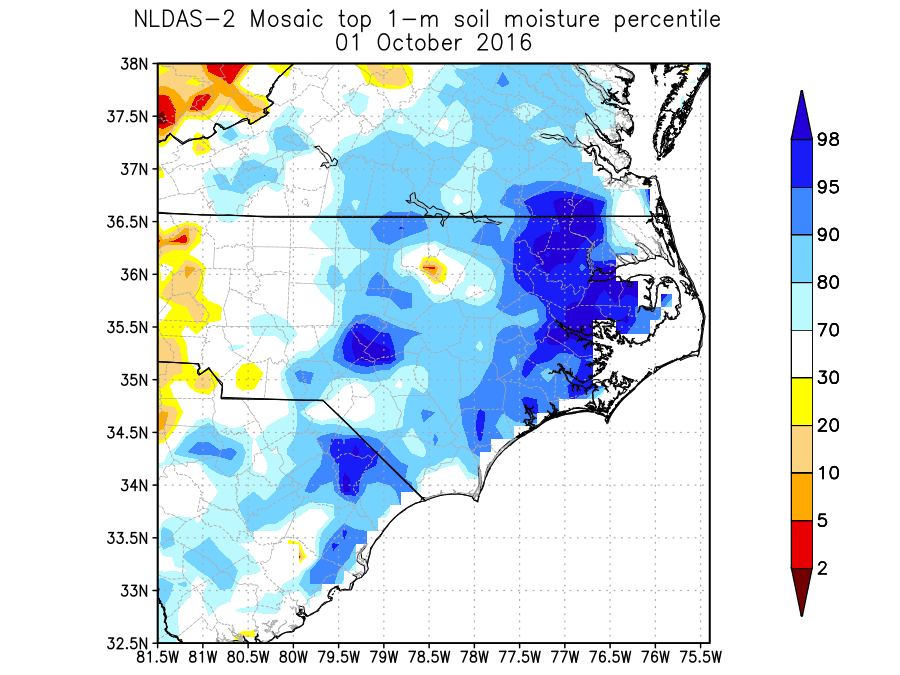
Figure 1: NLDAS-2 Mosaic soil moisture percentile for eastern North/South Carolina on Oct 1, 2016.
Figure 2 shows the percentage above/below normal September precipitation that occurred in September 2016 for the same locations. Significantly more rainfall fell than normal during the month in these areas.
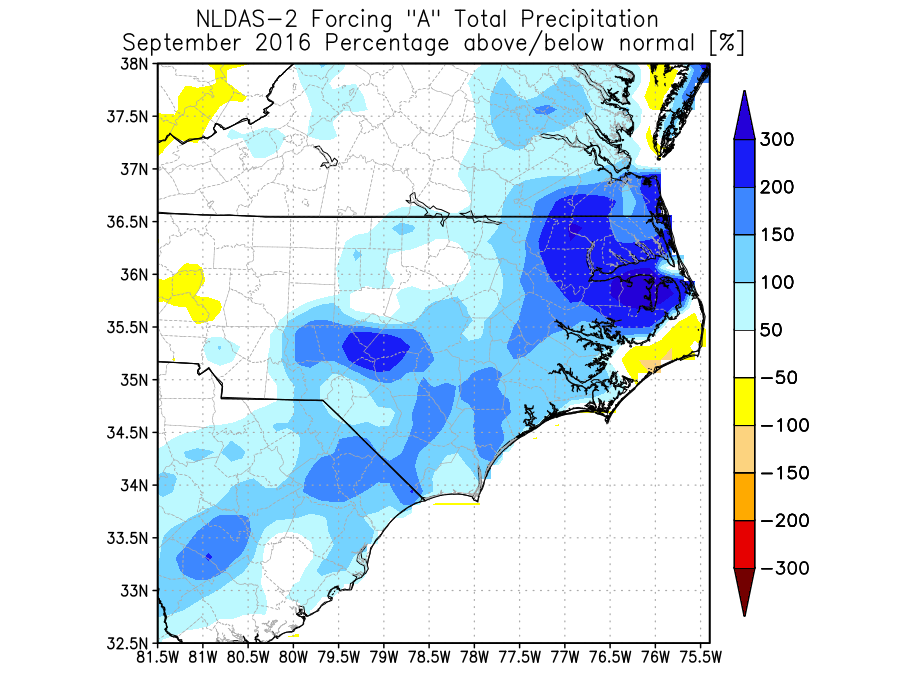
Figure 2: NLDAS-2 percentage above/below normal September precipitation for eastern North/South Carolina for Sep 2016.
Figure 3 shows the NLDAS-2 Mosaic LSM top 1-meter soil moisture percentile for Florida and southeastern Georgia. Wet soils are present on the west side of Lake Okeechobee in southern Florida and other locations further away from the Atlantic coast. Some locations, particularly near Jacksonville, FL, currently have drier than usual soil moisture. The NLDAS Drought Monitor will provide daily updates of the soil moisture and other land-surface conditions during and after the arrival of Hurricane Matthew.
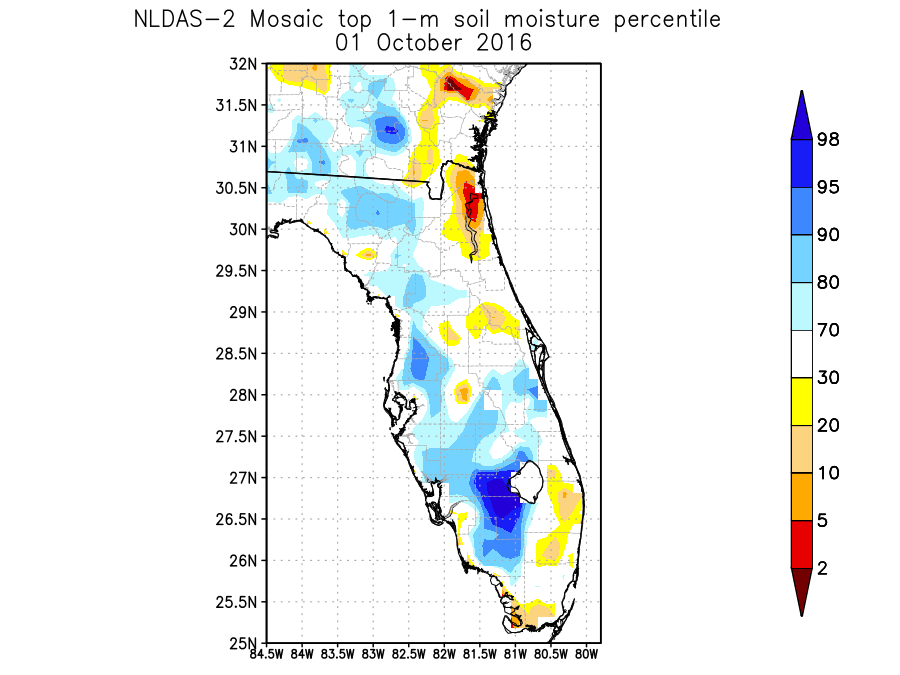
Figure 3: NLDAS-2 Mosaic soil moisture percentile for Florida and southeastern Georgia on Oct 1, 2016.
The North American Land Data Assimilation System (NLDAS) is a near real-time operational land-surface modeling system. NLDAS Phase 2 (NLDAS-2) produces a high-quality meteorological dataset used to drive four separate land-surface models (LSMs). A gauge-based observed precipitation analysis at 1/8th-degree is part of NLDAS-2, and the LSMs simulate soil moisture, surface fluxes, snow, runoff/streamflow, and other water/energy balance terms. These datasets are updated daily at NOAA's NCEP Central Operations. Hourly/monthly datasets going back to Jan 1979 are freely distributed, and are used by numerous agencies and by the public, including by the U.S. Drought Monitor. The Mosaic LSM is one of the NLDAS-2 LSMs, and is run using the Land Information System (LIS) software framework, developed at NASA Goddard Space Flight Center's Hydrological Sciences Laboratory.
NLDAS is a collaboration project primarily supported by two groups: NOAA/NCEP’s Environmental Modeling Center (EMC) and NASA/GSFC. Other groups that have contributed to NLDAS since its inception in 1999 include Princeton University, the University of Washington, the NOAA/NWS Office of Hydrological Development (OHD), and the NOAA/NCEP Climate Prediction Center (CPC). NLDAS is a core project with support from the NOAA Climate Program Office's Modeling, Analysis, Predictions, and Projections (MAPP) program. Data from the project can be accessed from the NASA Goddard Earth Science Data and Information Services Center (GES DISC) as well as from the NCEP/EMC NLDAS website. Full documentation is available at GSFC's NLDAS website.