Two recent Gulf Coast heavy precipitation events have occurred in the past few weeks, one in Louisiana, and the other in Florida. Starting on August 11, 2016, southern Louisiana received several days of heavy rainfall associated with a storm system that moved in from the Gulf of Mexico and stayed over the area for several days. The rainfall led to widespread and record flooding in the state. In Florida, Hurricane Hermine made landfall near St. Marks, FL on September 2, 2016. The storm moved rapidly through Florida, but did drop significant precipitation on many areas of the state.
The North American Land Data Assimilation System (NLDAS), a near real-time operational meteorological and land-surface modeling system, is used to depict these precipitation events and the soil moisture before and after. NLDAS Phase 2 (NLDAS-2) produces a high-quality meteorological dataset used to drive four separate land-surface models (LSMs). A gauge-based observed precipitation analysis at 1/8th-degree is part of NLDAS-2, and the LSMs simulate soil moisture, surface fluxes, snow, runoff/streamflow, and other water/energy balance terms. These datasets are updated daily at NOAA's NCEP Central Operations. Hourly/monthly datasets going back to Jan 1979 are freely distributed, and are used by numerous agencies and by the public, including by the U.S. Drought Monitor. The Mosaic LSM is one of the NLDAS-2 LSMs, and is run using the Land Information System (LIS) software framework, developed at NASA Goddard Space Flight Center's Hydrological Sciences Laboratory. This blog post depicts the precipitation and soil moisture fields in Louisiana and in Florida before and after these two events, including a quick look at antecedent conditions of soil moisture, which may have contributed to the flooding.
Figure 1 depicts the percentage above/below normal precipitation for the state of Louisiana (LA) for the monthly-average of August 2016 (from the NLDAS-2 precipitation field). Areas in white are within +/-50% of the NLDAS monthly climatological average (calculated over 1980-2009). Most of southern Louisiana experienced rainfall more than 200% above normal, or more than 3 times the typical amount. A few pockets experienced more than 300% above normal precipitation; one such area was near Baton Rouge, LA, centered near 30.5 North and 91.2 West.
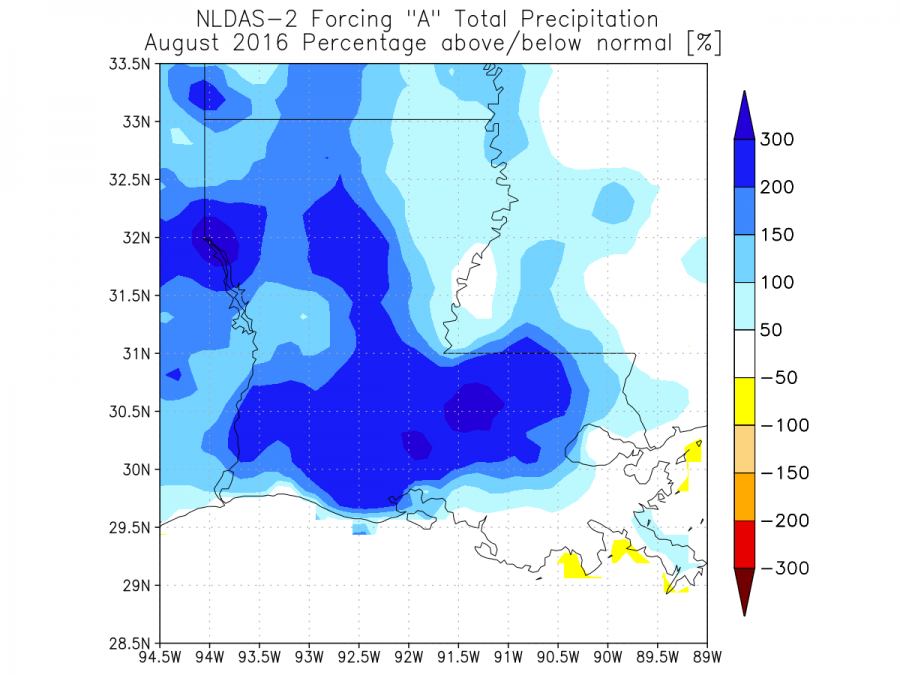
Figure 1: NLDAS percentage above/below normal precipitation for August 2016 for Louisiana.
Figure 2 depicts the percentage above normal of the soil moisture in the top 1-meter of the soil for August 2016 as simulated by the NLDAS-2 Mosaic LSM. The monthly-averaged soil moisture is above normal for nearly the entire state, with local maxima more than 25% above normal. These maxima tend to correspond to the heaviest precipitation locations depicted in Figure 1.
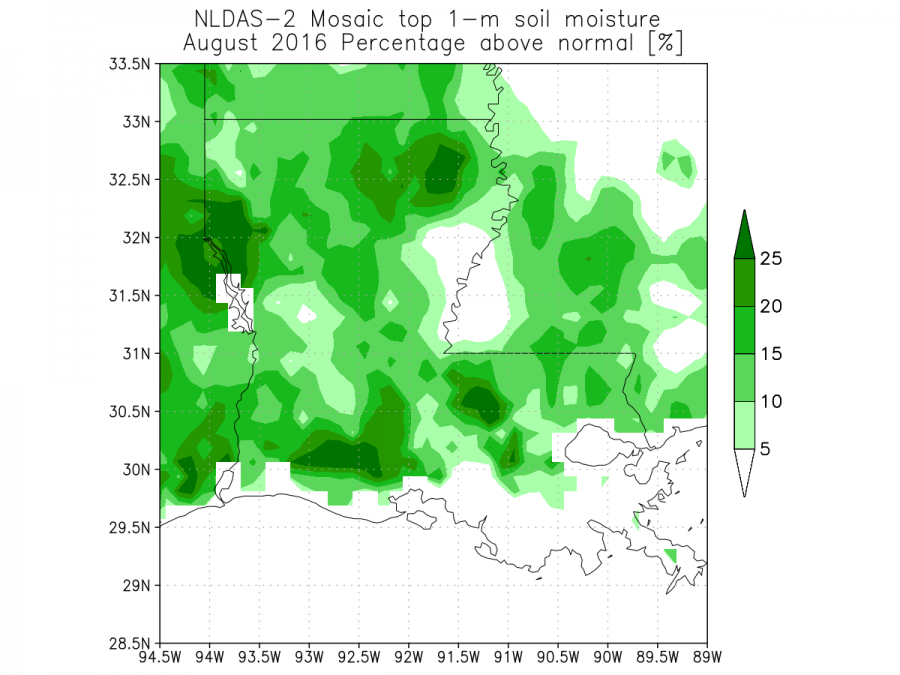
Figure 2: NLDAS percentage above normal top 1-meter soil moisture simulated by the Mosaic LSM for August 2016 for Louisiana.
Figure 3 shows the hourly precipitation amounts and soil moisture time series from late July to early September at 30.5 N and 91.2 West, located near Baton Rouge. The heavy persistent rain (blue bars) from late on August 11 into August 14 leads to a sharp increase in the top 1-meter soil moisture from the Mosaic LSM. Additionally, shorter intense precipitation events leading up to August 11 also caused the soil moisture to increase since late July.
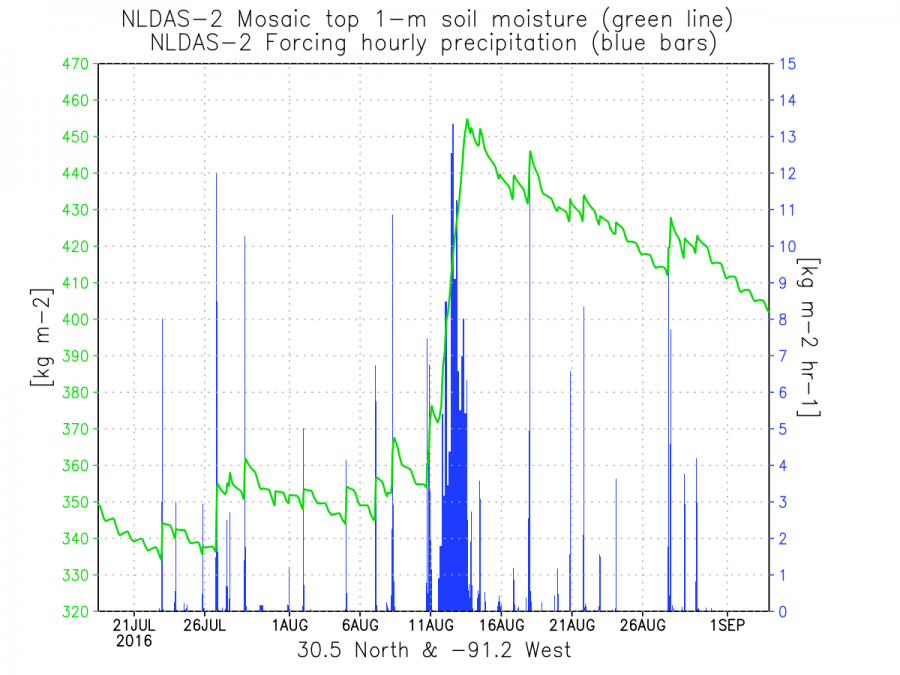
Figure 3: NLDAS hourly precipitation (blue) and soil moisture time series (green) for 30.5 North and 91.2 West, late July to early September 2016.
Figure 4 depicts the top 1-meter soil moisture percentile from the Mosaic LSM for August 10, 2016 (before the prolonged rain event began). The percentile is one of the products provided by NLDAS for the U.S. Drought Monitor, and shows where the current states fall within the NLDAS climatology for this time of year. The values show the percentage of years within the climatology with drier soils than on the exact date (in this case, August 10th). For example, areas with a value higher than 90 indicate that the current soil moisture values are wetter than 90% of the years for this time of the year. Localized areas of abnormally wet soils near 30.5 North and 91.2 West (near Baton Rouge, LA), as well as near 32.0 North and 94.0 West (near Logansport, LA) are coincident with high precipitation areas shown in Figure 1.
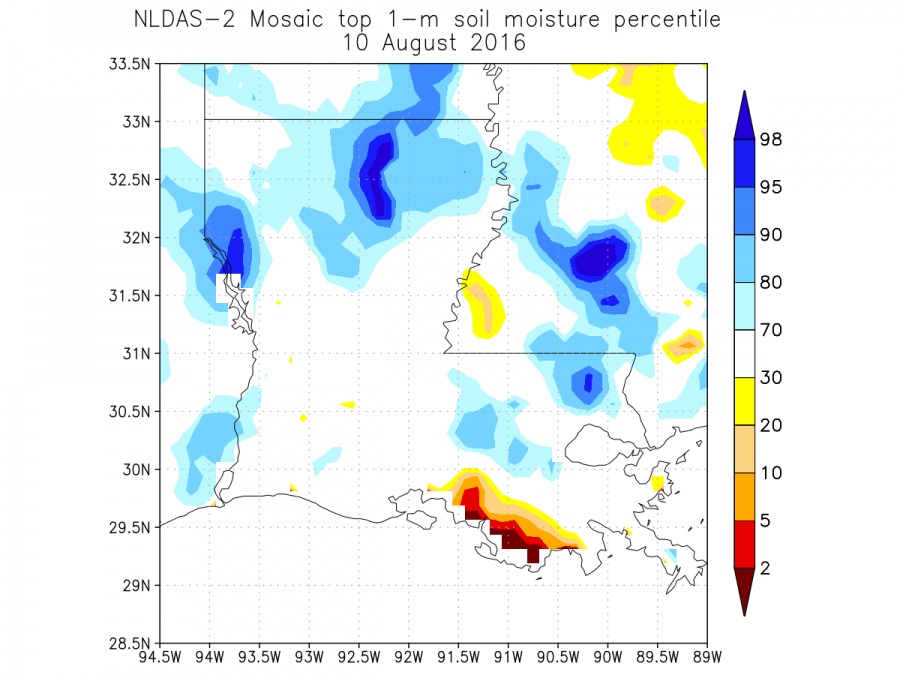
Figure 4: NLDAS Mosaic top 1-m soil moisture percentile for Louisiana on August 10, 2016.
Figure 5 is similar to Figure 3, except it shows a point in northern Florida (FL) at 30.45 North and 84.25 West. The passage of Hurricane Hermine over this area on September 2, 2016 is seen through the intense rain and sharp increase in the Mosaic LSM soil moisture at the end of the time series.
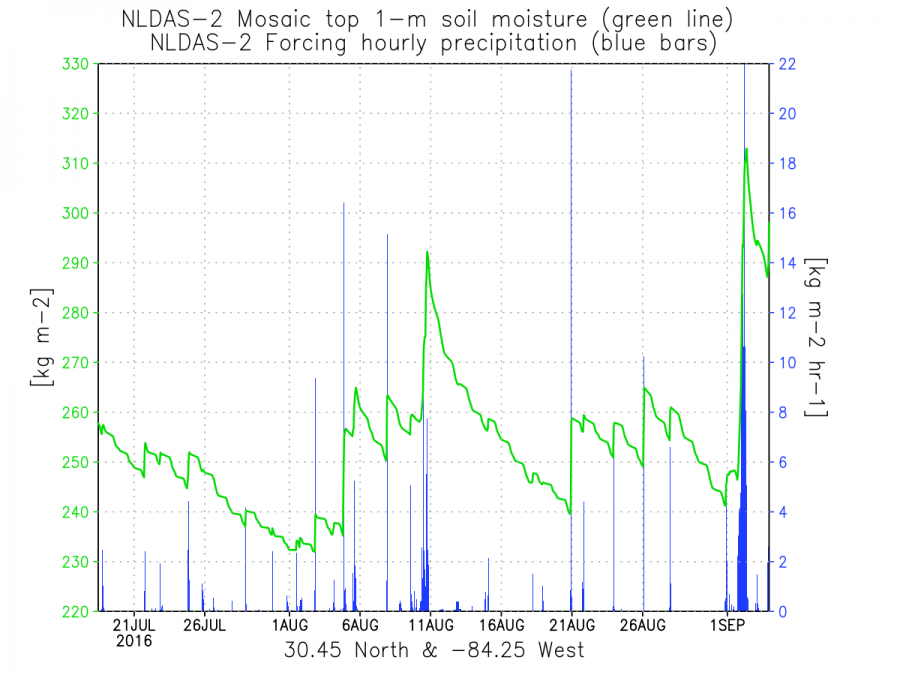
Figure 5: NLDAS hourly precipitation (blue) and soil moisture time series (green) for 30.45 North and 84.25 West, late July to early September 2016.
Figure 6 is similar to Figure 4, except that it depicts the Mosaic LSM top 1-meter soil moisture percentile for Florida on September 1, 2016, the day before Hermine made landfall. Many areas of northern Florida show above normal to between 80 to 90th percentile wet soil moisture. These same areas went on to experience significant rainfall from Hermine, leading to localized flooding.
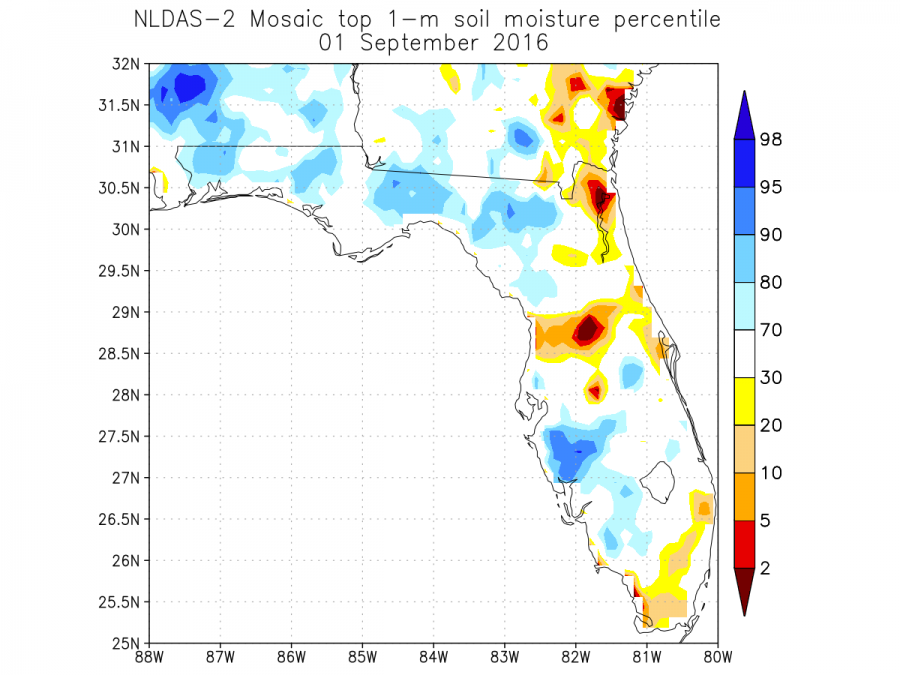
Figure 6: NLDAS Mosaic top 1-m soil moisture percentile for Florida on September 1, 2016.
NLDAS is a collaboration project primarily supported by two groups: NOAA/NCEP’s Environmental Modeling Center (EMC) and NASA/GSFC. Other groups that have contributed to NLDAS since its inception in 1999 include Princeton University, the University of Washington, the NOAA/NWS Office of Hydrological Development (OHD), and the NOAA/NCEP Climate Prediction Center (CPC). NLDAS is a core project with support from the NOAA Climate Program Office's Modeling, Analysis, Predictions, and Projections (MAPP) program. Data from the project can be accessed from the NASA Goddard Earth Science Data and Information Services Center (GES DISC) as well as from the NCEP/EMC NLDAS website. Full documentation is available at GSFC's NLDAS website.

