

North American Land Data Assimilation System (NLDAS) operational datasets are used to view the warm and dry conditions over the southeast United States in September 2019. NLDAS uses high-quality surface observations, including a precipitation gauge analysis, to drive several land-surface models (LSMs), and is updated daily at NOAA's NCEP Central Operations. Hourly, monthly, and monthly climatology NLDAS Phase 2 (NLDAS-2) datasets going back to Jan 1979 are available from the NASA GES DISC.
Figure 1 shows the NLDAS-2 anomaly of precipitation for September 2019; shown is the NLDAS-2 monthly total precipitation for September 2019 minus the NLDAS-2 monthly climatology (average) for September. The yellow and brown regions show regions with lower precipitation than usual for the month, and are widespread over much of the southeast U.S. One area that had much more rainfall than usual was in southeastern Texas from Tropical Storm Imelda.
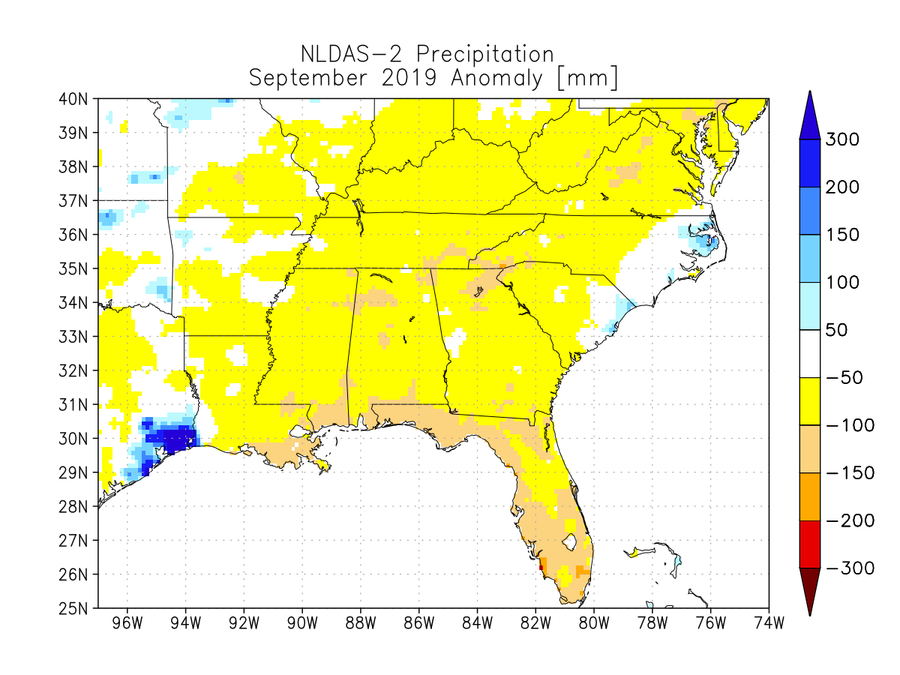
Figure 1: NLDAS-2 precipitation anomaly [mm] for September 2019.
Figure 2 shows the anomaly of shortwave radiation, or solar energy, downward at the surface from NLDAS-2. All of the southeast U.S. had positive anomalies for September 2019, indicating that more energy from the sun was reaching the surface. These anomalies are related to the amount of clouds in the atmosphere. When there are fewer clouds, more solar energy can reach the surface. The lower amounts of rain and clouds during September 2019 resulted in higher amounts of solar energy reaching the ground, which contributed to warmer surface temperatures and more energy available for surface fluxes from the ground to the atmosphere.
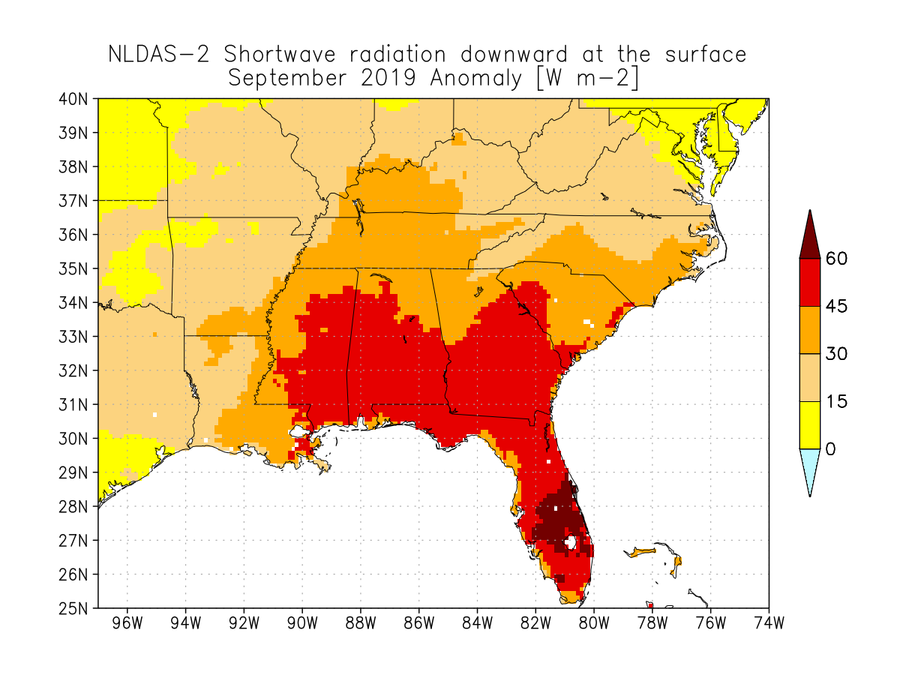
Figure 2: NLDAS-2 shortwave downward at the surface anomaly [W m-2] for September 2019.
Figure 3 shows the anomaly of sensible heat flux from the ground to the atmosphere for September 2019 from the NLDAS-2 Noah LSM. Much of the southeast had higher than usual sensible heat flux for the month. These higher values indicate both more energy available for surface fluxes as well as more of the energy going into sensible heat rather than evaporation. The drier surface conditions resulted in lower evaporation and higher sensible heat flux.
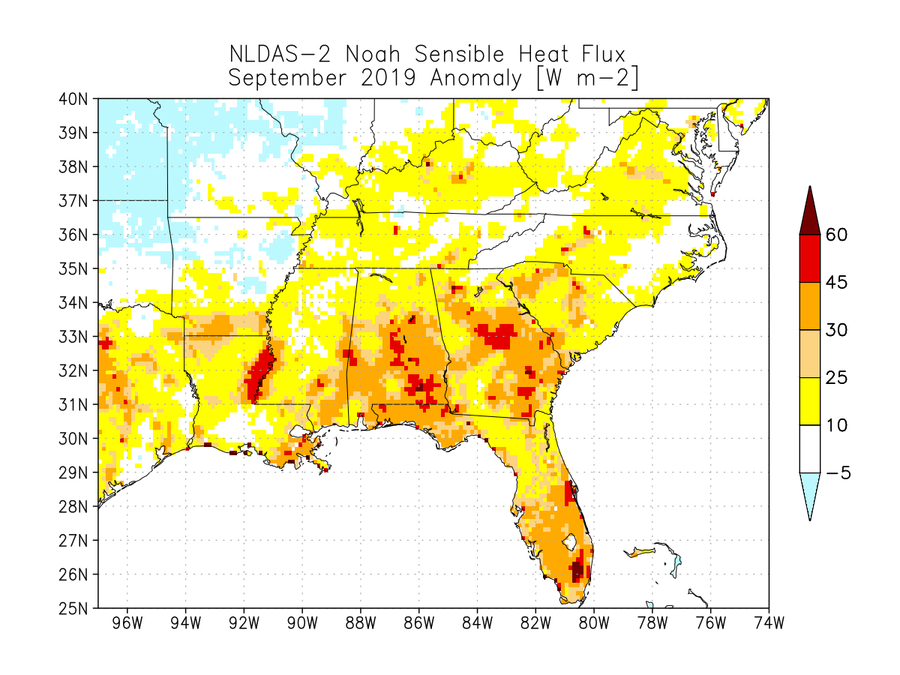
Figure 3: NLDAS-2 Noah sensible heat flux anomaly [W m-2] for September 2019.
Figure 4 shows the anomaly of the top 1-meter soil moisture from the NLDAS-2 Noah LSM. Drier than usual soil moisture values were found for much of the southeast during September 2019. The lower precipitation and soil moisture values, especially by the end of September, led the U.S. Drought Monitor to put much of the southeast U.S. into moderate to severe drought categories.
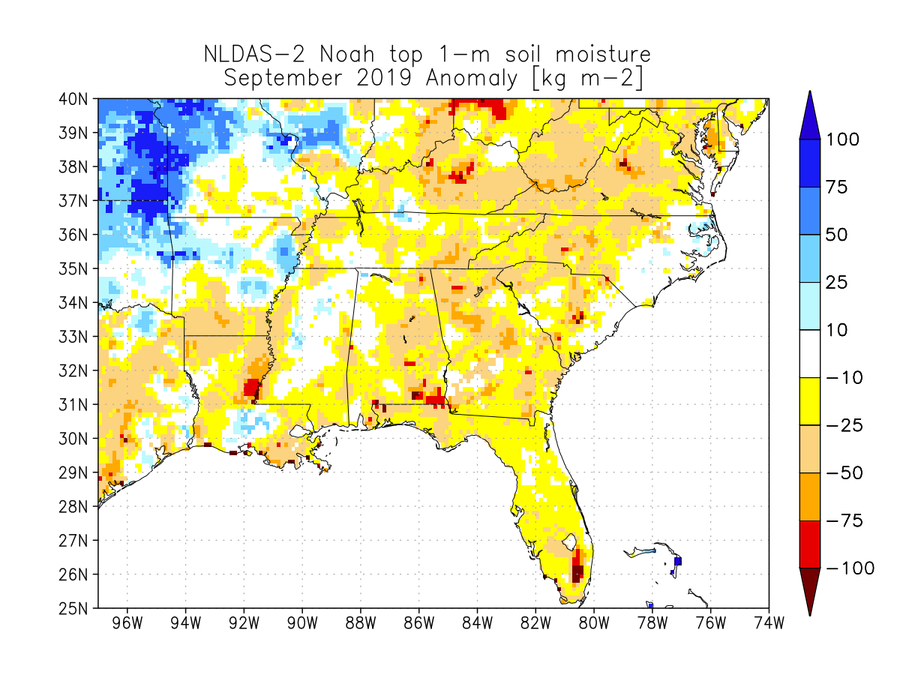
Figure 4: NLDAS-2 Noah top 1-meter soil moisture anomaly [kg m-2] for September 2019.
NLDAS is a collaboration project primarily supported by two groups: NOAA/NCEP's Environmental Modeling Center (EMC) and NASA/GSFC. Other groups that have contributed to NLDAS since its inception in 1999 include Princeton University, the University of Washington, the NOAA/NWS Office of Hydrological Development (OHD), and the NOAA/NCEP Climate Prediction Center (CPC). NLDAS is a core project with support from the NOAA Climate Program Office's Modeling, Analysis, Predictions, and Projections (MAPP) program. Data from the project can be accessed from the NASA Goddard Earth Science Data and Information Services Center (GES DISC) as well as from the NCEP/EMC NLDAS website. Full documentation is available at GSFC's NLDAS website.