
North American Land Data Assimilation System (NLDAS) operational datasets are used to view the winter of 2016-2017 over the continental United States. The eastern half of the U.S. was warm and dry, with many areas entering into drought. Meanwhile, the western half, particularly in California, received many Pineapple Express winter storms, leading to a significant reduction to a multi-year drought. NLDAS uses high-quality surface observations, including a precipitation gauge analysis, to drive several land-surface models (LSMs), and is updated daily at NOAA's NCEP Central Operations. Hourly/monthly NLDAS Phase 2 datasets going back to Jan 1979 are freely distributed and are widely used, including by the U.S. Drought Monitor.
Figure 1 shows the percentage of the average precipitation from NLDAS Phase 2 (NLDAS-2) for the three month winter period from December 2016 to February 2017. The average precipitation here is the 30-year average of the NLDAS-2 precipitation over the same Dec/Jan/Feb months from 1980 to 2009. Blue colors indicate above average precipitation, with many areas in California over 200 percent of average - or more than twice the typical winter. Yellow to red colors indicate below average precipitation - two notable areas are in Missouri/Illinois as well as in the Mid-Atlantic, in particular, in Maryland, D.C., Virginia, and North Carolina.
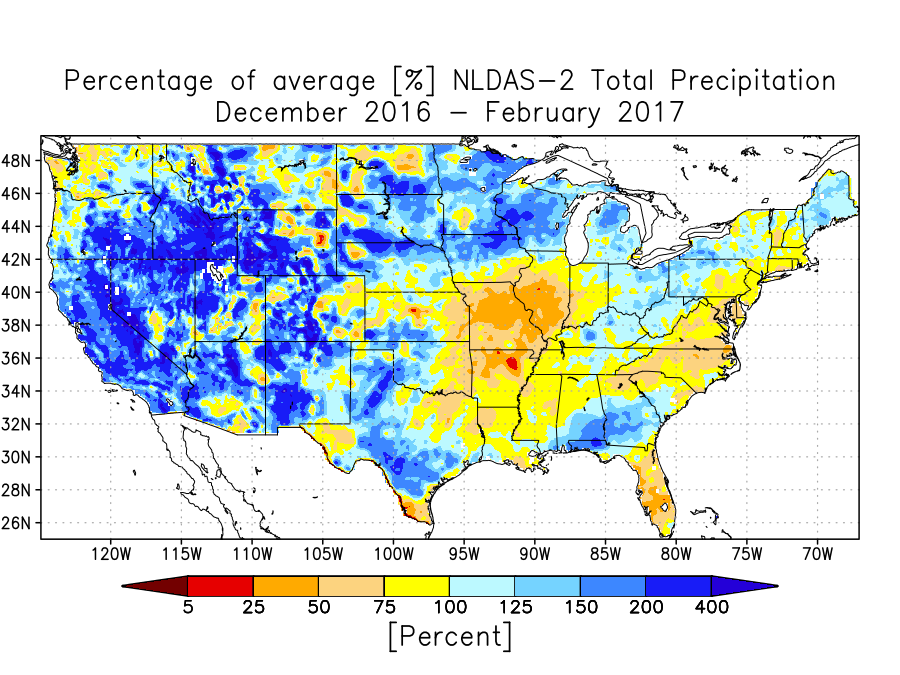
Figure 1: Percentage [%] of average winter NLDAS-2 precipitation for the winter of 2016-2017.
Figure 2 shows the anomalies (departure from average) of the 2-meter above ground temperature in NLDAS-2 for the same December 2016 to February 2017 winter period. Colder than average temperatures are found in the Northwest, while warmer than average temperatures are found over most of the central and eastern portions of the U.S.
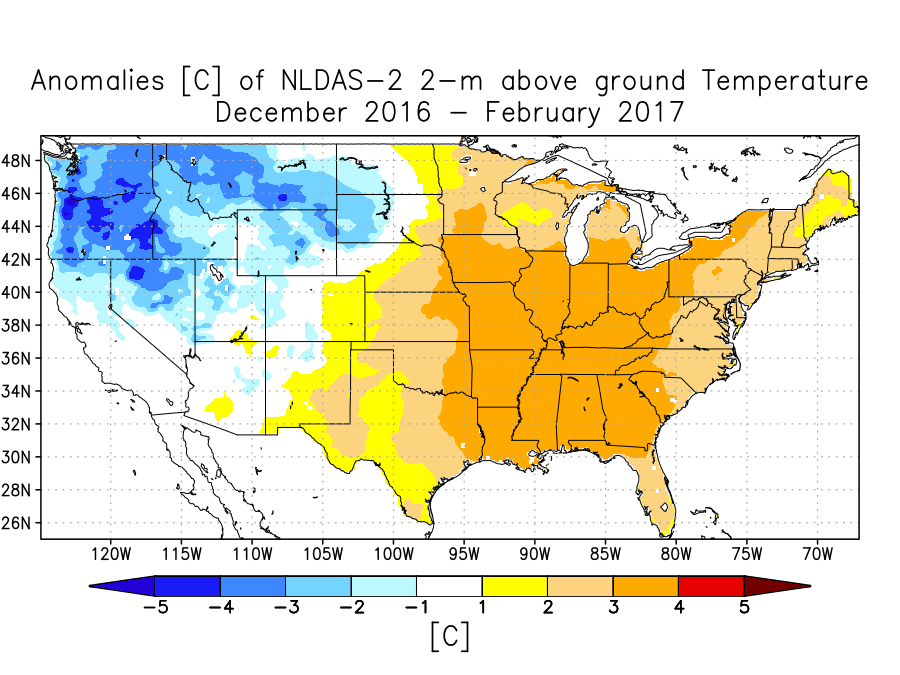
Figure 2: Anomalies [Celsius] of average winter NLDAS-2 2-m surface temperature for the winter of 2016-2017.
Figure 3 shows the anomalies of the NLDAS-2 Mosaic land-surface model (LSM) top 1-meter soil moisture for the winter of 2016-2017. The Mosaic LSM is run using the Land Information System (LIS) software framework, developed at NASA Goddard Space Flight Center's Hydrological Sciences Laboratory. The soil is much wetter than average in California and many other western areas, while it is drier than is typical for many eastern locations. The Mid-Atlantic has areas currently in moderate to severe drought.
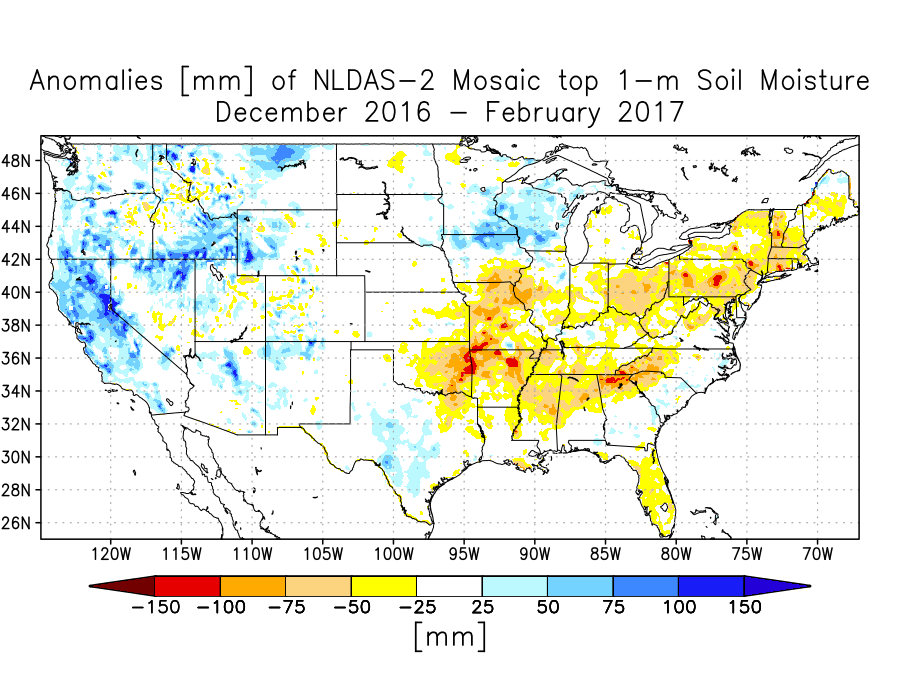
Figure 3: Anomalies [mm] of water in the top 1-meter of soil for the NLDAS-2 Mosaic LSM for the winter of 2016-2017.
Figure 4 shows an area-average time series of snow depth simulated by the NLDAS-2 Mosaic LSM for locations over 8,000 feet in elevation within California. Only locations over 8,000 feet are included in this average. The purple line shows the average for the winter of 2016-2017, while the black dashed line shows the average of 38 winters of NLDAS-2 Mosaic snow depth. The grey shading shows the maximum and minimum (or the range) of the snow depth over all 38 years for that particular date during the winter. The snow depth was generally below average until after January 1st, with large increases shown due to Pineapple Express storms. By late January, the snow depths during the winter of 2016-2017 were the maximum found over the 38 years of NLDAS-2 data, with the snow continuing to accumulate to the end of February.
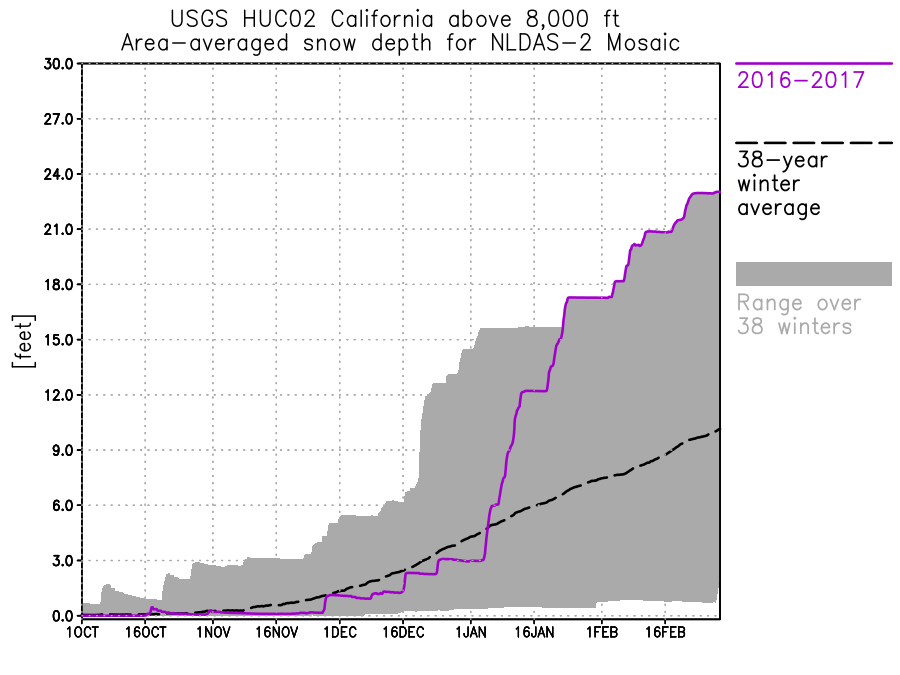
Figure 4: Time series of area-averaged snow depth [feet] from the NLDAS-2 Mosaic LSM for the winter of 2016-2017, compared to a long-term mean, maximum, and minimum.
NLDAS is a collaboration project primarily supported by two groups: NOAA/NCEP’s Environmental Modeling Center (EMC) and NASA/GSFC. Other groups that have contributed to NLDAS since its inception in 1999 include Princeton University, the University of Washington, the NOAA/NWS Office of Hydrological Development (OHD), and the NOAA/NCEP Climate Prediction Center (CPC). NLDAS is a core project with support from the NOAA Climate Program Office's Modeling, Analysis, Predictions, and Projections (MAPP) program. Data from the project can be accessed from the NASA Goddard Earth Science Data and Information Services Center (GES DISC) as well as from the NCEP/EMC NLDAS website. Full documentation is available at GSFC's NLDAS website.