
In a recent Washington Post article published on Friday, 13 July 2018 with the headline “With no rain in so long, it’s a ‘flash drought’”, it was declared that the greater Washington, DC region was in what is referred to as a flash drought due to the lack of measurable rainfall at DCA since 27 June. This article was first published as a Capital Weather Gang post on Thursday 12 July. While we certainly sympathize with agricultural producers who have experienced drought-like impacts from the two weeks of dry and hot weather, we disagree with classifying it as a flash drought. The term ‘flash drought’ has gotten a lot of attention recently, and as pointed out in an American Meteorological Society research article (Otkin et al., 2018) published earlier this summer, there are certain criteria that need to be met in order to distinguish a flash drought from a typical dry spell. First, longevity and impact are fundamental characteristics of any drought. Thus, there needs to be some minimum length of about 4 weeks for it to be considered a flash drought, at least in a mid-latitude location like Washington that doesn’t have a very distinct rainy season. Second, the rate of intensification needs to be unique in space and time. In other words, if it is normal to be hot and dry for a few weeks in the summer, then it shouldn’t be classified as a flash drought. But if it persists for over a month and that is abnormal, then the flash drought classification is likely valid.
Another reason we do not believe classification of flash drought was warranted in the region is that the root zone soil moisture (from the surface to 1-meter deep) that plants utilize was generally still in the ‘normal to moist’ range for this time of year as of 12 July (Fig. 1), with only a few areas east of the city showing at most “abnormally dry” conditions, but not yet a drought. The NLDAS (North American Land Data Assimilation System) soil moisture products, shown here, have been rigorously evaluated for drought monitoring efficacy across the entire continental U.S. and have proven to be quite accurate.
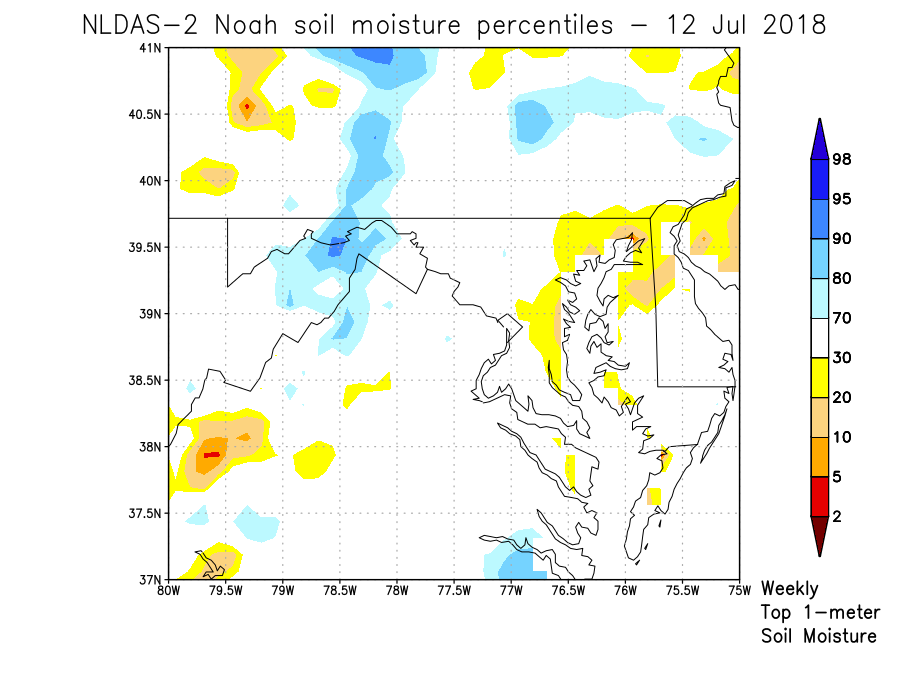
Figure 1. Soil moisture percentiles from the NLDAS Phase 2 Noah LSM for the top 1-meter of the soil. The percentiles are based on an historical context using a 33-year climatology from NLDAS for each grid point at this time of the year. The color shadings indicate various drought categories defined by the U.S. Drought Monitor, from D0 (abnormally dry, yellow) to D4 (exceptional drought, dark red). Abnormally moist areas on the same scale are shown in blue shades.
The U.S. Drought Monitor (USDM), considered the gold standard for drought monitoring, valid on 10 July (Fig. 2) shows no locations in the D.C. area with even “abnormally dry” conditions, reinforcing that the area was not quite yet in a drought.
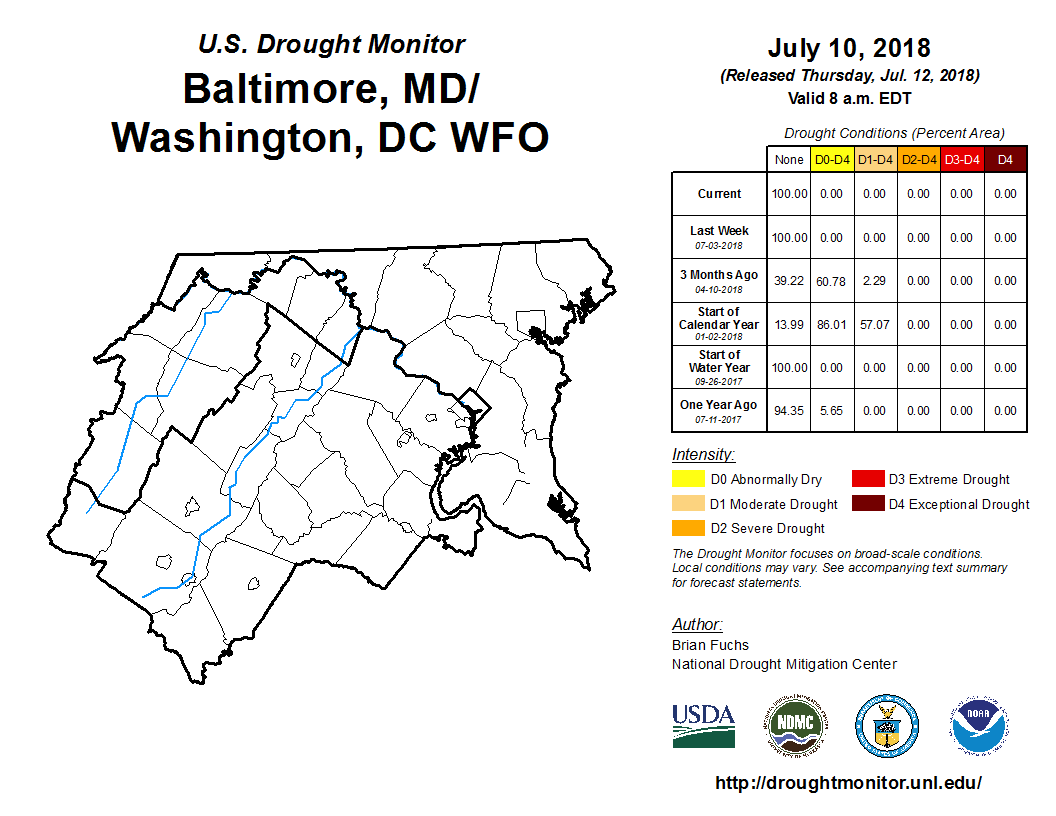
Figure 2. U.S. Drought Monitor depiction valid on 10 July 2018 for the Baltimore/Washington Weather Forecast Office region.
An area-averaged time series of the percentage of the DC area (over a 1-degree box centered around DC, approximately 30 miles in each cardinal direction) experiencing different USDM categories from the NLDAS-2 Noah LSM top 1-meter soil moisture is shown in Fig. 3. Only at most 20 percent of the area was “abnormally dry” by 12 July, which pales in comparison to some of the recent drier periods this past winter and spring.
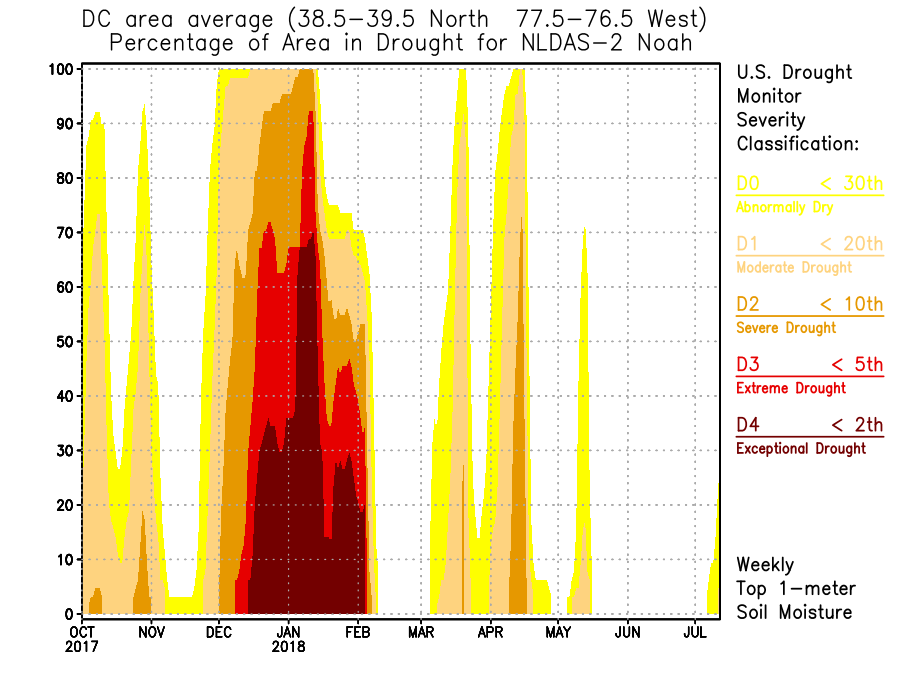
Figure 3. Percentage of the D.C. area (1-degree box over 38.5-39.5 North and 77.5-76.5 West) under different USDM drought conditions as given by the NLDAS-2 Noah LSM top 1-meter soil moisture.
Although it is likely that the top part of the soil was quite dry, leaving unwatered lawns to turn brown, it is the root zone soil moisture that can indicate the longevity and impact necessary for flash drought determination. Fig. 4 shows volumetric soil moisture fraction for the same 1-degree box over DC for the four soil moisture layers in the NLDAS-2 Noah LSM. The 0-10cm surface layer does indeed rapidly dry out due to a lack of rainfall as well as high evaporation from hot temperatures. The deeper soil moisture layers are not as dry, and still retain much moisture from the wet May and June in the area. As for any crops in the region that may look stressed, they probably were indeed water stressed and there is potential for yield losses for the growing season. But this is more an artifact of the excessive wetness earlier in the growing season (April-May) than the dry spell. Crops, like any other vegetation, need it to be at least marginally dry for a few periods during its vegetative stage to develop a strong root structure. In years where cool and wet conditions persist into the time when vertical root development is critical, they can be very susceptible to even short spells of heat and dryness.
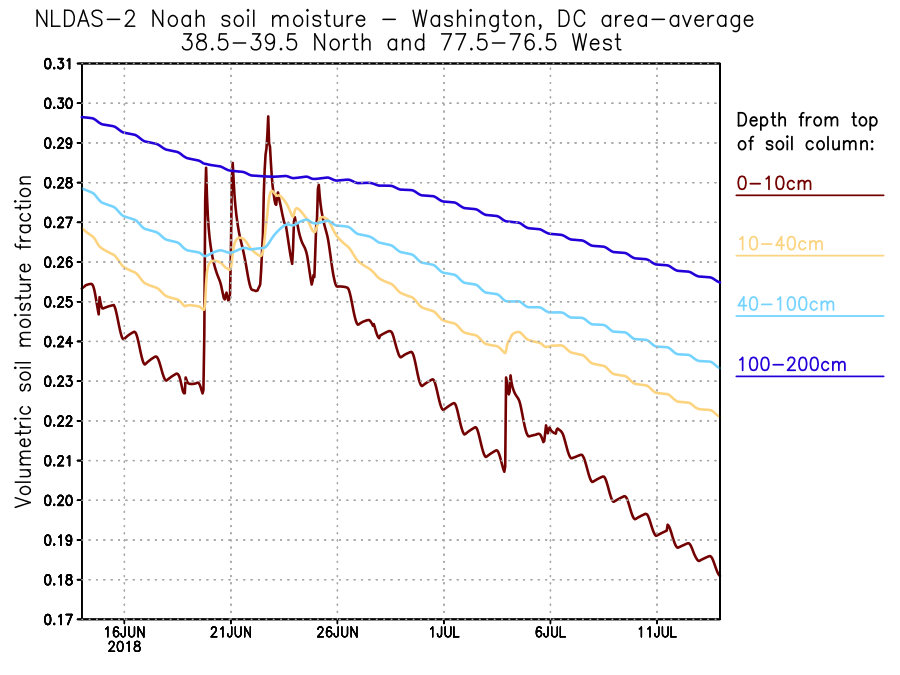
Figure 4. NLDAS-2 Noah LSM volumetric soil moisture fraction (fraction of the depth containing water) for the four soil layers of Noah (0-10cm depth, 10-40cm, 40-100cm, and 100-200cm), area-averaged in a 1-degree box centered over Washington DC.
The most recent USDM depiction of the area (released today, valid on Tuesday, 17 July, and not reflecting the rain later that afternoon) shows only D0 "abnormally dry" conditions in and around DC (Fig. 5), with no areas showing D1 (or more severe) drought conditions.
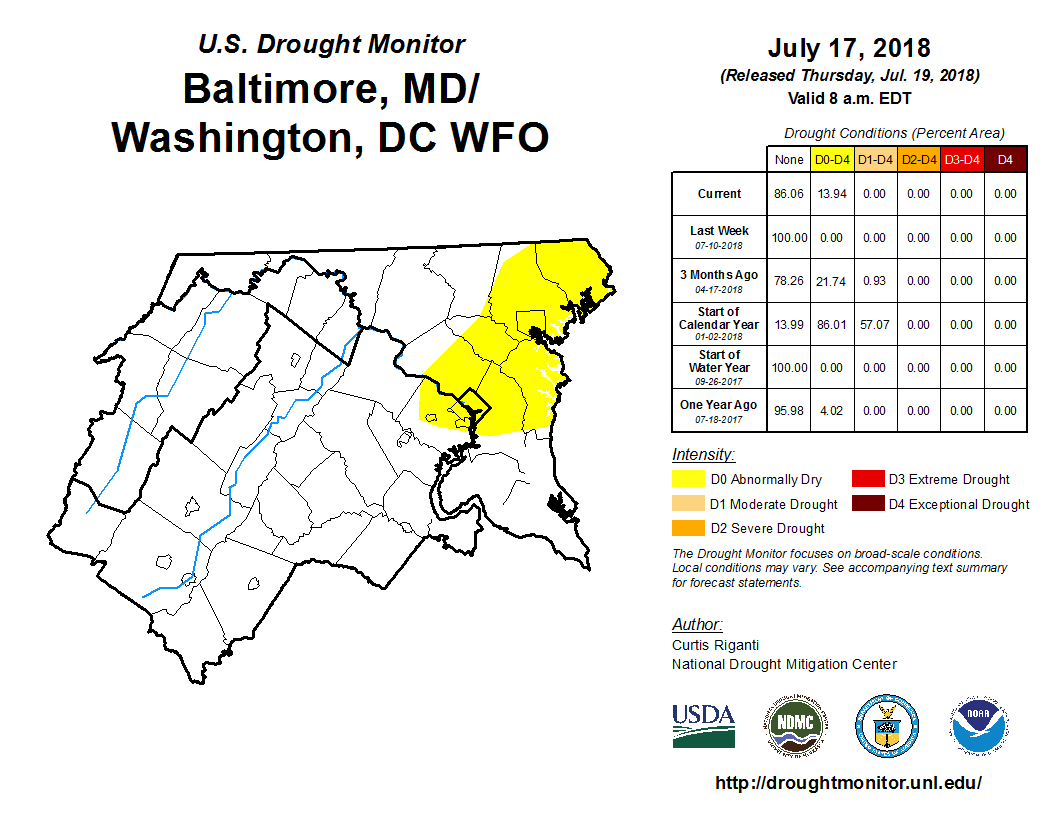
Figure 5. U.S. Drought Monitor depiction valid on 10 July 2018 for the Baltimore/Washington Weather Forecast Office region.
In summary, we believe the conditions may have been coming together for a flash drought in the Washington region. But a two-week period without rain alone does not suffice, and we would like to make sure the term is not misused or misunderstood (as has been the fate of other meteorological terms that have dominated social media lately). Incidentally, we should also note that the dry spell ended on Tuesday, 17 July in impressive fashion, with nearly 3 inches of rain falling in less than 1 hour at DCA (Capital Weather Gang post). While not all areas around DC received this much rain, the areas that did likely have ended any possibility of a flash drought forming this July.
Submitted by Eric Hunt (Atmospheric and Environmental Research, Inc.), Joe Santanello (NASA/GSFC), Jason Otkin (University of Wisconsin-Madison/SSEC/CIMSS), David Mocko (SAIC at NASA/GSFC), Sujay Kumar (NASA/GSFC), and Patricia Lawston (ESSIC at NASA/GSFC)
NLDAS is a collaboration project primarily supported by two groups: NOAA/NCEP’s Environmental Modeling Center (EMC) and NASA/GSFC. Other groups that have contributed to NLDAS since its inception in 1999 include Princeton University, the University of Washington, the NOAA/NWS Office of Hydrological Development (OHD), and the NOAA/NCEP Climate Prediction Center (CPC). NLDAS is a core project with support from the NOAA Climate Program Office's Modeling, Analysis, Predictions, and Projections (MAPP) program. Data from the project can be accessed from the NASA Goddard Earth Science Data and Information Services Center (GES DISC) as well as from the NCEP/EMC NLDAS website. Full documentation is available at GSFC's NLDAS website. NLDAS is also one of the contributing datasets to the QuickDRI (Quick Drought Response Index) product, which was designed to detect the effects of drought at time intervals of a month or less.